Bar Graphs Lesson Plan: Measurement and Data
*Click to open and customize your own copy of the Bar Graphs Lesson Plan.
This lesson accompanies the BrainPOP topic Bar Graphs and supports the standards of drawing a scaled bar graph to represent a data set with several categories and solving one- and two-step problems using information presented in scaled bar graphs. Students demonstrate understanding through a variety of projects.
Step 1: ACTIVATE PRIOR KNOWLEDGE
Display this image from the movie (timestamp 0:56):
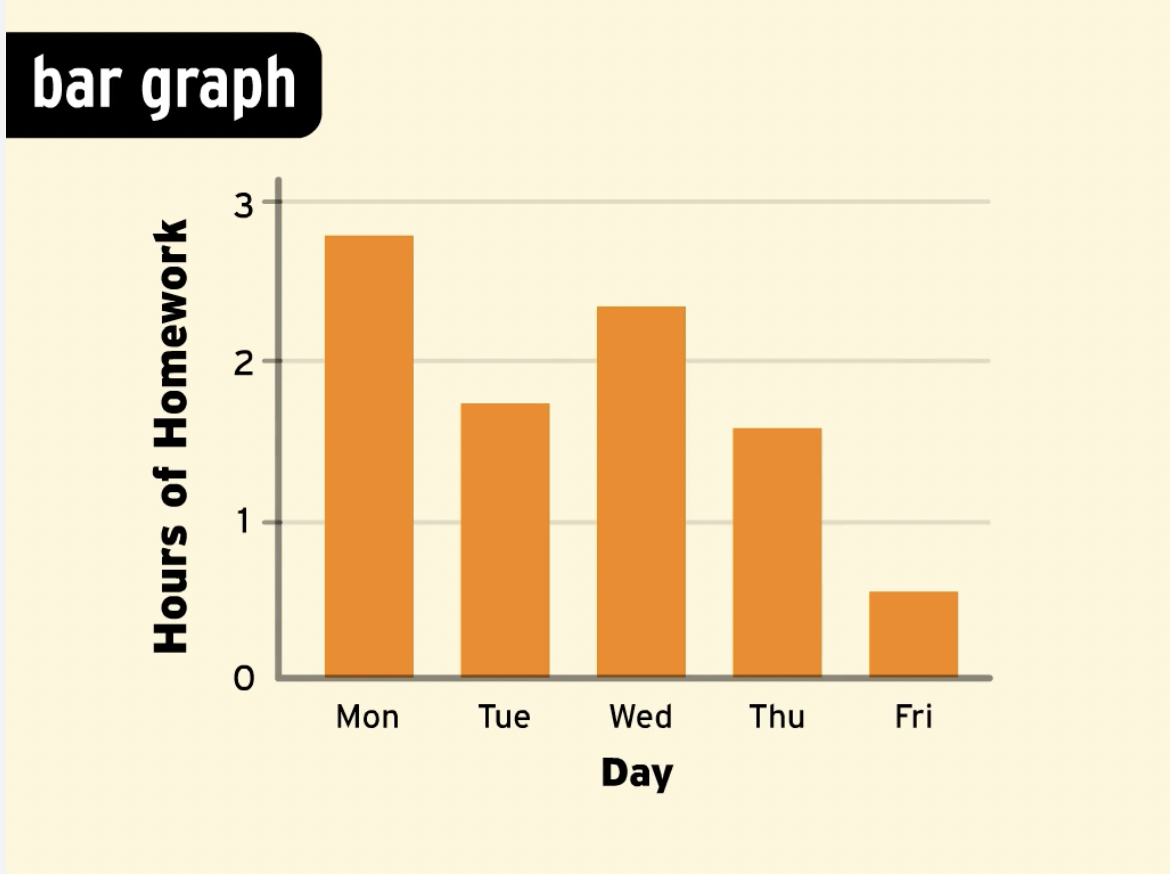
Ask students:
- What can you learn from this graph?
- Which day has the most hours of homework? Which day has the least?
Step 2: BUILD KNOWLEDGE
- Read the description on the Bar Graphs topic page.
- Play the Movie, pausing to check for understanding.
Step 3: APPLY and ASSESS
Assign Bar Graphs Challenge, prompting students to apply essential literacy skills while demonstrating what they learned about this topic.
Step 4: DEEPEN and EXTEND
Students express what they learned about bar graphs while practicing essential literacy skills with one or more of the following activities. Differentiate by assigning ones that meet individual student needs.
- Make-a-Movie: Produce a tutorial explaining how to make a bar graph from data in a table. Include details about how to set the scale.
- Make-a-Map: Create a concept map identifying parts of a bar graph and explaining the purpose of each part.
More to Explore
Related BrainPOP Topics: Deepen understanding of using data to solve problems with these topics: Graphs, Coordinate Plane, Multi-Step Word Problems.
Teacher Support Resources:
- Pause Point Overview: Video tutorial showing how Pause Points actively engage students to stop, think, and express ideas.
- Learning Activities Modifications: Strategies to meet ELL and other instructional and student needs.
- Learning Activities Support: Resources for best practices using BrainPOP.


