Potential & Kinetic Energy Lesson Plan: PhET Energy Skate Park Simulation
Submitted by: Sarah Borenstein, Campus Middle School
In this lesson plan, students use an interactive simulation called Energy Skate Park to understand the relationships between stored energy and the energy of motion. Students will use a model to visualize and describe the interactions of the skater with the track. They will then describe how energy can be transformed and apply to real world situations.
Students will:
- Examine how kinetic and potential energy interact with each other
- Interpret graphical displays of data to describe the relationships of kinetic energy to to the speed of an object
- Describe how energy can be transformed and apply to real world situation
- Examine how friction affects the motion of objects
Materials:
- Computers or other devices with Internet access
- Interactive whiteboard
- Speed, Potential Energy, Kinetic Energy printable
Preparation:
This lesson features an interactive simulation titled Energy Skate Park, developed by our award-winning partner PhET through the University of Colorado Boulder. The simulation invites students to explore the conservation of mechanical energy with a skateboarder on different tracks. Students investigate how mass, height, speed, and friction relate to the energy in the system. Bar and pie charts represent the skater’s energy, which students can relate to the position and speed of the skater. Students can build their own tracks, ramps, and jumps for the skater.
Watch the Energy Skate Park video primer for an introduction to the Energy Skate Park simulation’s features and uses. Then review the Energy Skate Park Simulation Overview for a summary of the of sim controls, model simplifications, and insights into student thinking.
Preview and play with the Energy Skate Park sim to plan how you will adapt it to your students’ needs. If students will be working in small groups, review tips on Setting Cooperative Gaming Expectations.
Print out and distribute the Speed, Potential Energy, Kinetic Energy printable.
Depending on your classroom routines and available technology, you may want to consider these grouping options:
- 1:1 with students and devices
- Two to three students sharing one device and swapping ideas and the device back and forth
- Station model where small groups rotate through using the devices.
Lesson Procedure:
- Play one or more of the BrainPOP movies listed in Preparation section on a whiteboard to build background or to reinforce what students already know about the topic of energy.
- Working individually, with a partner, or in small groups, have students open the Energy Skate Park simulation. Instruct them to click the Playground option and explore the simulation by clicking and dragging the tracks to make different loops and hills.
- In their notebooks, have students list variables they are able to change in the simulation.
- Now have students create a track with at least one hill and one loop and draw their design in their notebooks. Instruct them not to start their skater on the track until they’ve drawn it.
- Now have them place their skater at the top of the track. Using the SnapThought tool, take a snapshot of what happens to the skater at the end of the track.
- Next, have students click the Intro option of the Energy Skate Park simulation and explore. In their notebooks, have them list the variables that they can change.
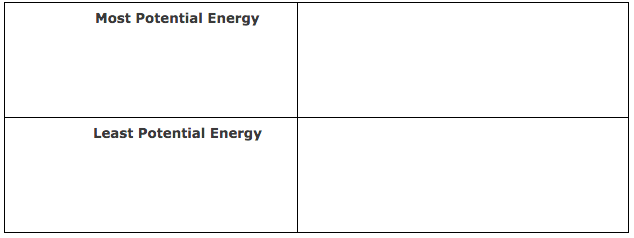
- Display the following table on the whiteboard and have students copy it into their notebooks. Then have them describe or draw in the table how they change the amount of potential energy in the table. Make sure they have either the pie chart or bar chart graph option check in the simulation.
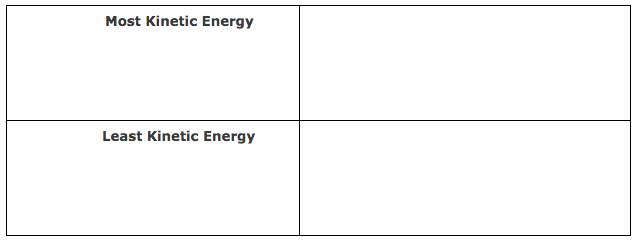
- Now display the table below on the whiteboard and have students copy it into their notebooks. Have them describe or draw how they can change the amount of kinetic energy.
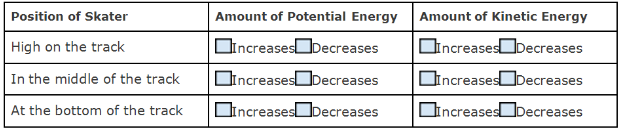
- Then display the following table on the whiteboard, and invite up volunteers to identify what happens to the potential and kinetic energy of the skater when he is on the different parts of the track. Note that students should check either the pie chart or bar graph options.
- In their notebooks, have students make a claim about the relationship between kinetic energy and potential energy. Tell them to include evidence.
- Distribute the Speed, Potential Energy, Kinetic Energy printable. Instruct students to use the diagram to label where they’ll think the speed of the skater will be the greatest. In the table, have them describe what happens to the speed of the skater when he is on the different parts of the track. Make sure they have speed checked in the sim. Then have them answer these questions in their notebooks:
- What claim can you make about the relationship between potential energy, kinetic energy, and speed?
- What is your evidence?
- How can you change the total energy in the simulation?
- Now have students click the Friction option and explore the simulation. Have them list in their notebooks the variables they can change.
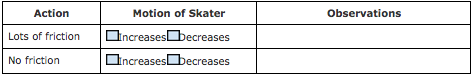
- Display the following table and have students copy it in their notebooks. Instruct them to describe the motion of the skater when they change the amount of friction. They should be sure to have either pie chart or bar graph selected. When the table is complete, have students make a claim using evidence about how friction affects the motion of the skater in their notebooks.
- Finally, have students click the Playground option again. Explain to them that if the skater was not able to complete the track, they should revise their design in their notebooks. Remind them that the design must include one hill and one loop. Instruct them as follows:
- Label the points on the track where the potential energy of the skater is the greatest (PE).
- Label the points on the track where the kinetic energy of the skater is the greatest (KE).
- Label the points on the track where potential and kinetic energy are equal (PE=KE).
- In their notebooks, have students explain how potential energy, kinetic energy, and friction affected their track. Then have students share their explanations in a class discussion.


