Exploring Point-Slope of a Line: PhET Graphing Lines Simulation
Submitted by: Amanda McGarry, PhET Interactive Simulations
In this lesson plan, students use an interactive simulation called Graphing Lines to explore the parameters of the slope formula and how modifying the graph affects the equation or modifying the equation affects the graph.
Students will:
- Write an equation in point-slope form
- Graph a line given an equation in point-slope form
Materials:
- Computers or other devices with Internet access
- Point-Slope Activity Sheet
- Notecards
Preparation:
This lesson features an interactive simulation titled Graphing Lines, developed by our award-winning partner PhET through the University of Colorado Boulder. The simulation challenges students to investigate the relationships between linear equations, slope, and graphs. The game in Graphing Lines has six levels of increasing difficulty.
Photocopy a class set of the Point-Slope Activity Sheet.
Review the Graphing Lines Overview for a summary of the of sim controls, model simplifications, and insights into student thinking.
Preview and play with the Graphing Lines simulation to plan how you will adapt it to your students’ needs. If students will be working in small groups, review tips on Setting Cooperative Gaming Expectations.
Depending on your classroom routines and available technology, you may want to consider these grouping options:
- 1:1 with students and devices
- Two to three students sharing one device and swapping ideas and the device back and forth
- Station model where small groups rotate through using the devices.
Lesson Procedure:
- Warm Up
Display the two graphs below on the whiteboard or other display.
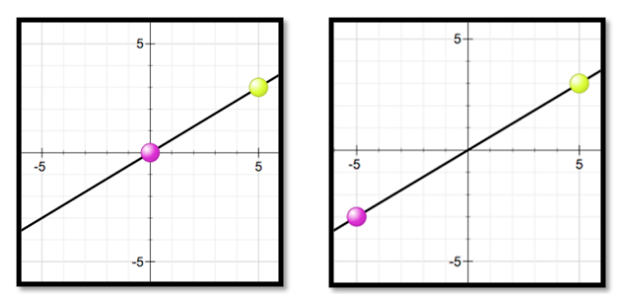 Activate students’ prior knowledge by leading a discussion or having students journal about the following prompt and questions:
- Find the slope of the two lines.
- What is different about their slopes?
- What is similar?
- Introduction Model for the class on a whiteboard how to access the Graphing Lines sim. Then working independently or with a partner, have students explore the Point-Slope screen of the sim.
- Guided Exploration Distribute the Point-Slope Activity Sheet. Instruct students to complete the activity sheet while interacting with the Point-Slope screen of the sim.
- Circulate the room to be available for questions and ask probing/pushing questions, such as the following:
- What is the relationship between the numbers in the equation and the graph?
- Why do you think this [pink point] is colored this way?
- How is point-slope form similar to slope-intercept form? What information do they both give us?
- How is point-slope form different from slope-intercept form?
- Think of a time when the point-slope form of a line is useful.
- Prompt pairs to stop and compare their responses to questions c and d above. Note student responses and conversations. Facilitate a brief discussion about those questions with the sim and or activity sheet projected on the whiteboard. Invite students to share aloud with the class.
- Discuss
Facilitate a class discussion to bridge an understanding across representations.Use an established teaching strategy such as popcorn discussion (one student answers, calls on the next student to talk), think-pair-share (pose question, allow time to think, turn and talk to partner), or group discussions (print out questions and have groups talk to each other and write down consensus to share aloud with class). Sample questions include:
- Why is this equation named “point-slope”?
- What do lines with the same m look like?
- What do lines with the same (x1, y1) look like?
- What does the equation of a vertical line look like? How does this relate to point-slope form?
- What does the equation of a horizontal line look like? How does this relate to point-slope form?


